Project Description
This project is the result of the CA for Interactive Media Design and Visualization module (2017). The information used for this project is publicly available and updated every 5 minutes on Dublin City Website. The dataset contains free parking spaces data points. The main objective is to discover trends on parking hours, and somehow understand any correlation between all the data presented.
This data was collected for a year and used for this specific assignment on Tableau, showing peak and off peak times, and occupancy trends in a range of visualizations.
Occupancy percentages are calculated based on the max free spaces for each parking in the dataset.
Project Visualizations
- Main Dashboard
- Occupancy Trends by Breakdown
- Occupancy Trends by Day
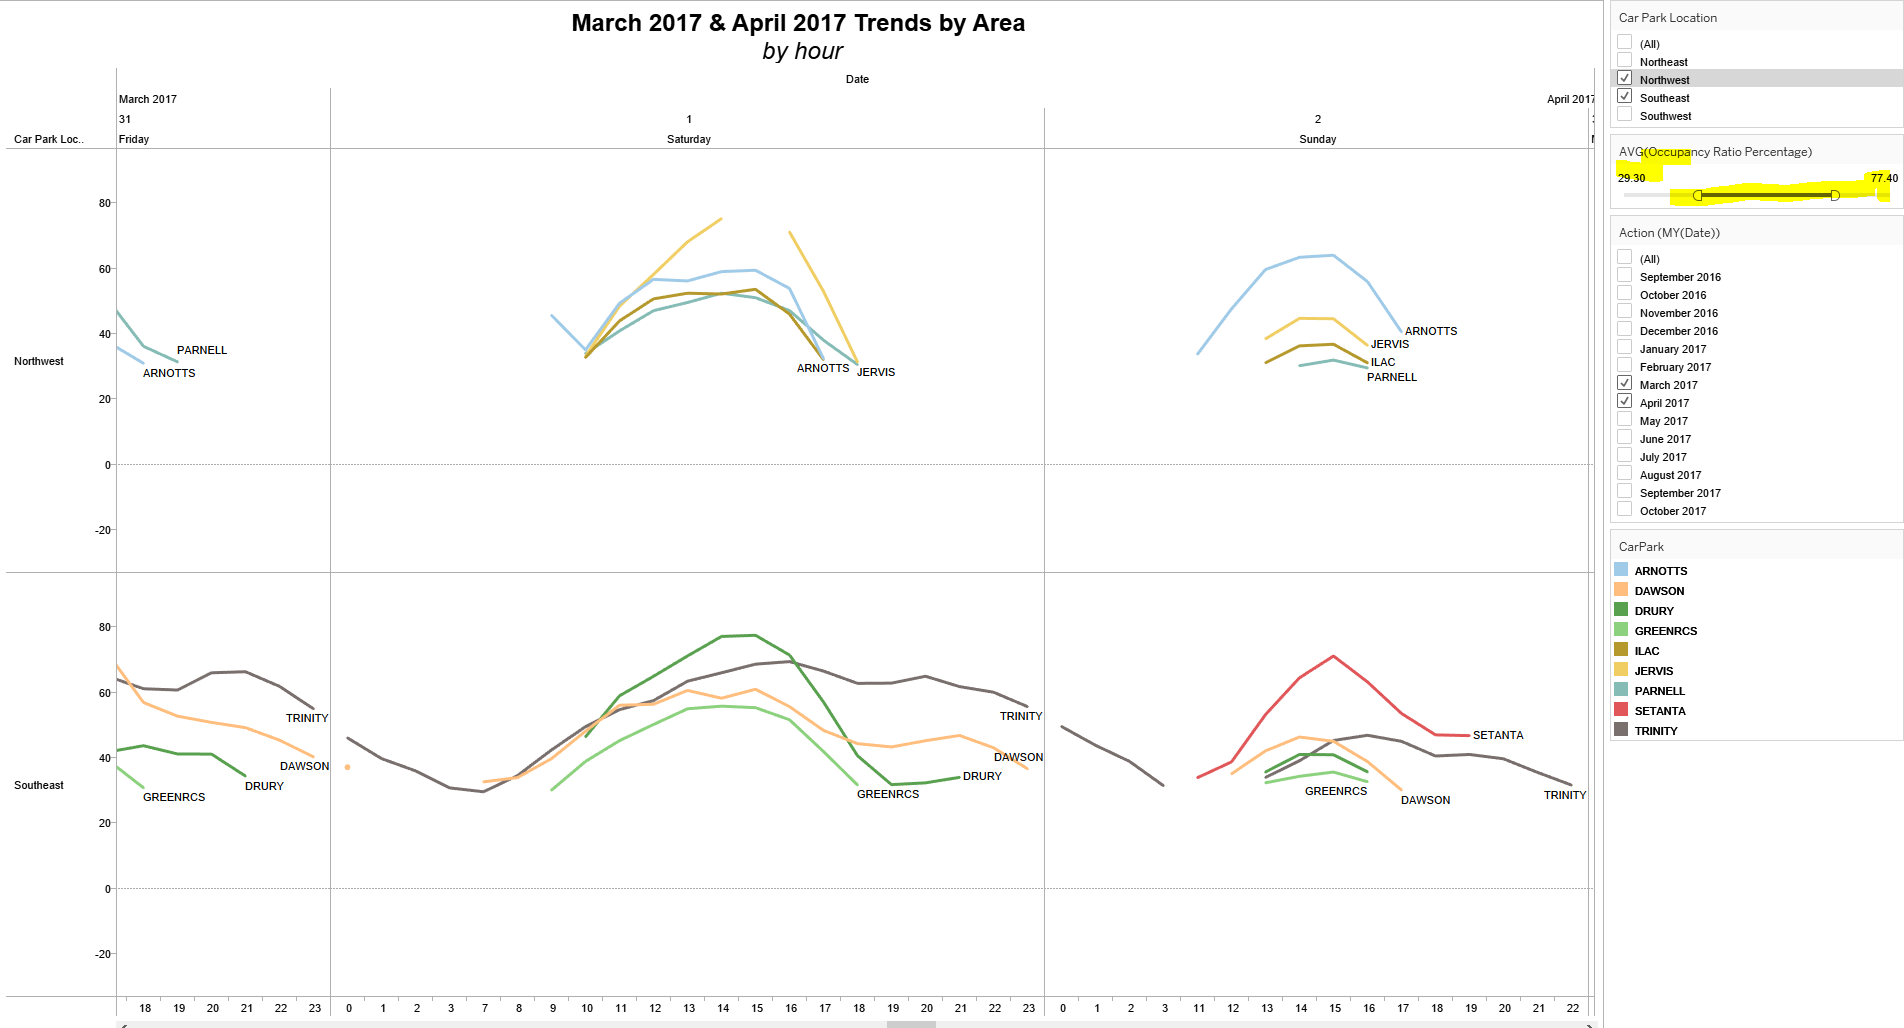
- Monthly Occupancy Trends by Hour

Conclusions obtained
- Specific defined trends across days of week for each parking. E.g. some days show remarkable peak hours while a Sunday shows a very low activity
- These trends may be an indication of predictors of available parking spaces based on day, and hour
- Considerable visual resemblance within parkings on the same areas, which may be an indication of congestion in some locations
- None of the parkings reaches 100% of occupancy
Download Report
Available Visualizations


